New Relic charts for the memes
New Relic has a wonderful library of charts that users can add to their dashboards and custom applications. One of which is the Heatmap chart which allows the presentation of a series of data (y-axis) across a common attribute (x-axis). In this post, I explain how I used these charts for…unintended purposes.
Author’s note: I currently work as an employee at New Relic, but the opinions in this post are my own and not the view of my employer.
Background
The concept for this post isn’t completely new. A few years ago, a wonderful article was posted on hackernews about using Prometheus to store ascii art. About a year later another post was published taking the concept further: rendering color images (and even short video) using Grafana! Both of these posts stuck with me as a really creative way to use a tool in an unintended way.
About a year later, I finally got to use the New Relic Heatmap chart:
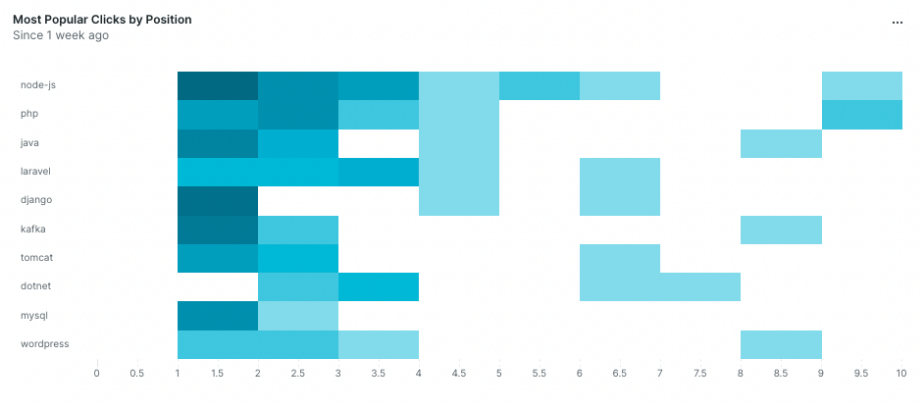
It didn’t take long for me to see this humble chart as the canvas for which I could craft many a meme. Let me explain my process.
Breaking down an image
The Heatmap chart (essentially) takes in a 2D array of values and will shade the “cells” darker based on the reltative value of the cell. A higher number is a darker cell. In order to build out a data set based on an image, we need to do the following:
- Divide the image up into “cells”.
- Get the average color of all the pixels in each cell.
- Determine the “brightness” of that color.

Getting the average color of a cell
The real MVP of this work is getImageData() from the CanvasRenderingContext2D. Using this, we can pull out the red, green, blue, and alpha values for each pixel. Here’s the function that makes use of it:
const average = (xs) => xs.reduce((a, b) => a + b, 0) / xs.length;

const getAverageColor = (ctx, x, y, width, height) => {
  const imageData = ctx.getImageData(x, y, width, height);

  let r = [];
  let g = [];
  let b = [];

  for (let i = 0; i < imageData.data.length; i += 4) {
    r.push(imageData.data[i]);
    g.push(imageData.data[i + 1]);
    b.push(imageData.data[i + 2]);
  }

  return {
    r: average(r),
    g: average(g),
    b: average(b),
  }
};
Determine the cell brightness
Once we have the average RGB values, it’s fairly trivial to determine the brightness. This is the value we use for the cell.
const getBrightness = ({ r, g, b }) => (r + g + b) / 3;At this point we can render the image. I have a proof-of-concept codepen that renders this to a <canvas /> element. Getting it into New Relic is the next step.
Rendering the chart
We can use the cell data in a custom New Relic visualization (or anywhere else in the platform). First we need to create a <canvas /> element to gain access to the CanvasRenderingContext2D functions (no need to add it to the DOM). Then we render image in it with context.drawImage (a meme, of course) and execute the functions outlined above. Finally we map the brightness data into the chart format:
const getChartData = (ctx, rows, cols, width, height) => {
let results = [];
for (let i = 0; i < rows; i++) {
results[i] = {
metadata: {
id: `series_${i}`,
name: `Series ${i}`,
viz: "main",
},
data: [],
};
for (let j = 0; j < cols; j++) {
const y = i * height;
const x = j * width;
const color = getAverageColor(ctx, x, y, width, height);
const brightness = getBrightness(color);
results[i].data.push({
x0: j,
x1: j + 1,
y: 256 - brightness, // invert color
});
}
}
return results;
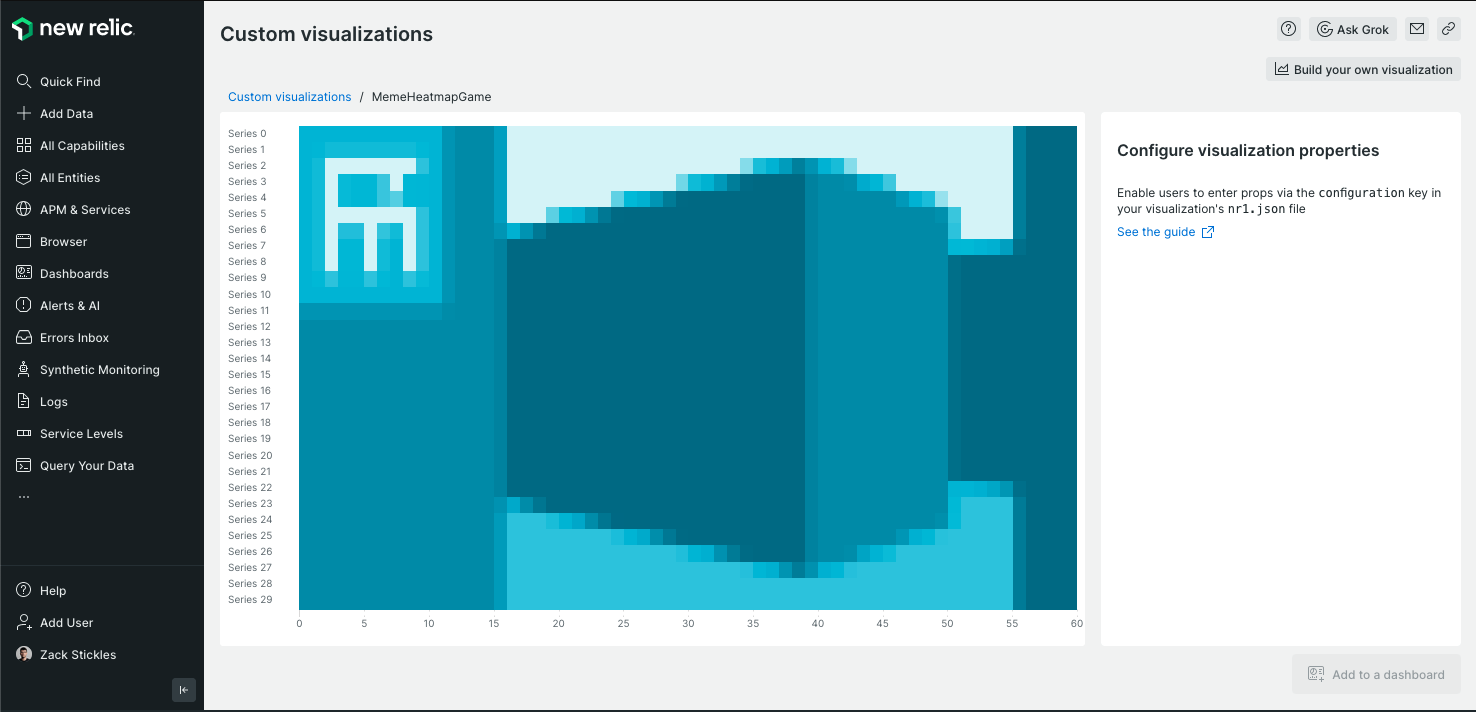
};And with that, we’ve got an image rendered in a Heatmap chart!

Taking the joke further
Static images are fun and all, but how could we take the joke further? My mind immediately went to rick-rolling. Can we push the Heatmap chart to play video? Yes, yes we can.
To play a video, we create a <video /> element (again, no need to be in the DOM), attach a source (.mp4 file), and begin playing when the video has loaded:
const videoEl = document.createElement("video");

videoEl.setAttribute("crossOrigin", "");
videoEl.src = VIDEO_SRC;
videoEl.muted = true;
videoEl.autoplay = true;

const canvas = document.createElement("canvas");
const ctx = canvas.getContext("2d");

videoEl.oncanplay = (_event) => {
  canvas.width = videoEl.videoWidth;
  canvas.height = videoEl.videoHeight;

  videoEl.play();
};

videoEl.addEventListener("play", () => {
  updateCanvas(ctx, canvas, videoEl);
});
After that, we can use canvas.drawImage with the video as the image source. Toss that in a setTimeout that runs every couple hundred milliseconds and we’ve got a (choppy) video!

Taking the joke even further
So I had a little more time this week and I thought: what is the next logical step up in the meme space? Well…can it run DOOM? Let’s find out!
DOOM takes advantage of a process called ray casting to render a scene. I opted to go with a simple implementation that is more similar to Wolfenstein3D that has a uniform wall height and lacks things like stairs and windows.
Breaking down how the raycasting engine works is outside of the scope of this post (but I will happily write a follow-up post if there’s interest). The basic idea is that you draw slices of the viewport (rays) that are calculated from the player’s perspective:
Here’s a snippet of code that actually renders the scene. I’ll save the technical trigonometry bits for another post:
const renderScene = (rays) => {
  rays.forEach((ray, i) => {
    const dist = fixFishEye(ray.dist, ray.rad, player.rad);
    const wallHeight = ((CELL_SIZE * 2) / dist) * 277;

    ctx.fillStyle = ray.vertical ? COLORS.WALL_DARK : COLORS.WALL;
    ctx.fillRect(i, SCREEN_HEIGHT / 2 - wallHeight / 2, 1, wallHeight);

    ctx.fillStyle = COLORS.FLOOR;
    ctx.fillRect(
      i,
      SCREEN_HEIGHT / 2 + wallHeight / 2,
      1,
      SCREEN_HEIGHT / 2 - wallHeight / 2
    );

    ctx.fillStyle = COLORS.CEILING;
    ctx.fillRect(i, 0, 1, SCREEN_HEIGHT / 2 - wallHeight / 2);
  });
};
In JavaScript, all the rendering is done on a <canvas />, so the previous methods of taking canvas information and converting it to chart data still applies. With a few adjustments (and wiring up some event handlers for keyboard input) and we have a game…in a Heatmap chart!!!
Conclusion
Sure. That’s cool…but can it run Skyrim?
No.
If you have any other questions, feel free to reach out to me on Mastodon: @zstix@fosstodon.org.